
Scptu seismic piezocone survey with dual g1-cpls ti receiver
SCPTU SEISMIC PIEZOCONE SURVEY WITH DUAL G1-CPLS TI RECEIVER
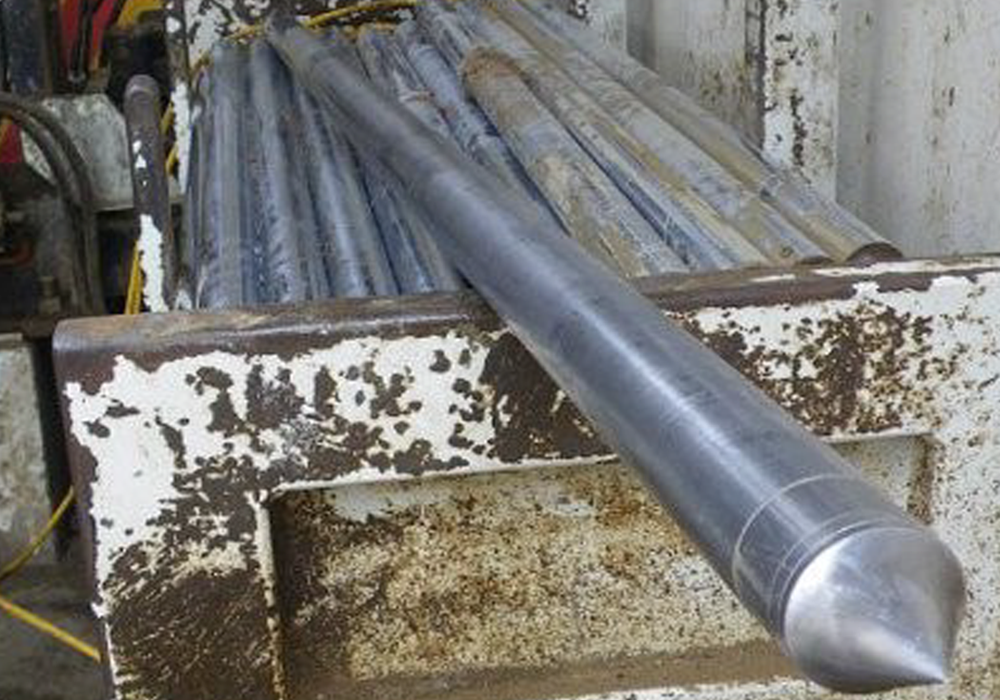
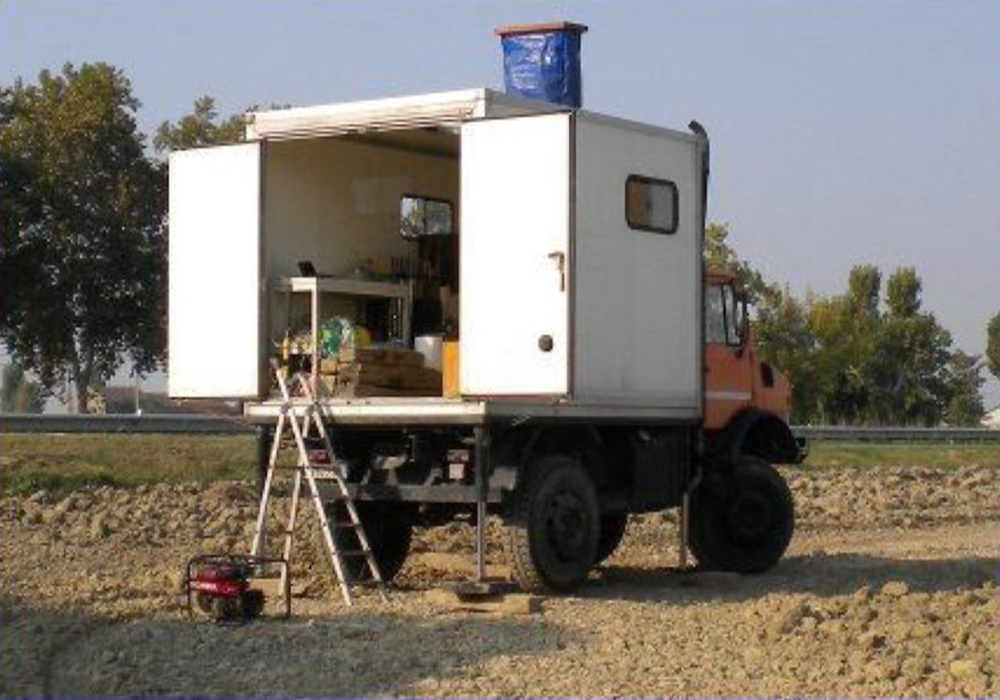
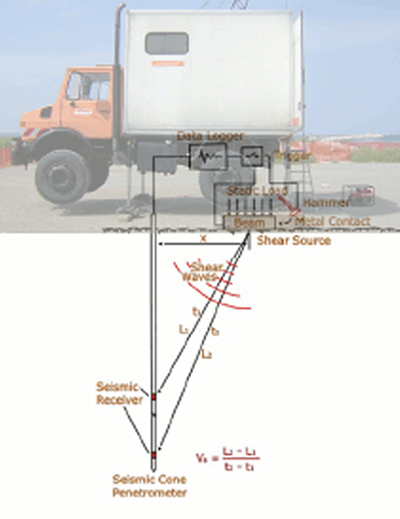
The seismic piezocone with double receiver is an instrument created to carry out CPTu penetrometric tests and to additionally determine the shear wave velocity Vs with the interval method, also known as the true interval method. It is therefore able to acquire the same wave generated by a single energization with two receivers at different depths. The two receivers are three-axis accelerometers separated by a distance of 100 cm and the closest to the cone is approximately 15 cm from the tip resistance measurement cell. The three axes of the accelerometers are directed like the three Cartesian axes and therefore called X, Y, Z. The seismic tip, as during a normal static penetrometric test, is driven into the ground and measured in physical progress. At pre-established heights the advancement is stopped to perform the energization and acquisition of the seismic signals (down-hole technique). A good source for this type of test must be capable of generating large amplitude shear waves with little or no compressional component. The source used for this work is a wooden sleeper loaded through a truck stabilizer that mounts the push system. The sleeper generates a shear impulse following a lateral blow of a 12 kg sledgehammer on one of the short vertical sides.
EXECUTION OF THE MEASUREMENT
After positioning the wooden beam beneath the stabilizer, we proceed with the penetration of the piezocone into the ground up to the depth at which to perform the first acquisition of the shear waves. When mounting the piezocone on the battery of rods it is best to orient one of the axes of the accelerometers parallel to the beam in order to obtain maximum sensitivity in that direction. The tip resistance, lateral friction, pore pressure, inclination and temperature data are acquired every 2 cm and in addition the penetration speed is also recorded, maintained at 2 cm per second by the thrust system. Once the chosen depth has been reached, the drilling rods are released from the truck, lifting the thrust head of the penetrometer, so as to prevent the transmission of vibrations between the truck and the battery of rods. We proceed then with the first energization on the right side of the beam and if the acquired signal satysfying certain criteria we proceed with the energization on the opposite side in order to obtain two sets of similar data but with opposite polarity. The two data sets with different polarity help during the interpretation phase.
The tests and processing were carried out by the UNIGEO, company based in Padua

E-mail: i n f o @ u n i n g e o . i t
Mob. +39 347 564 7666 +39 328 156 1930
Via Guglielmo Marconi, 52 - 35123 Padova (Italy)
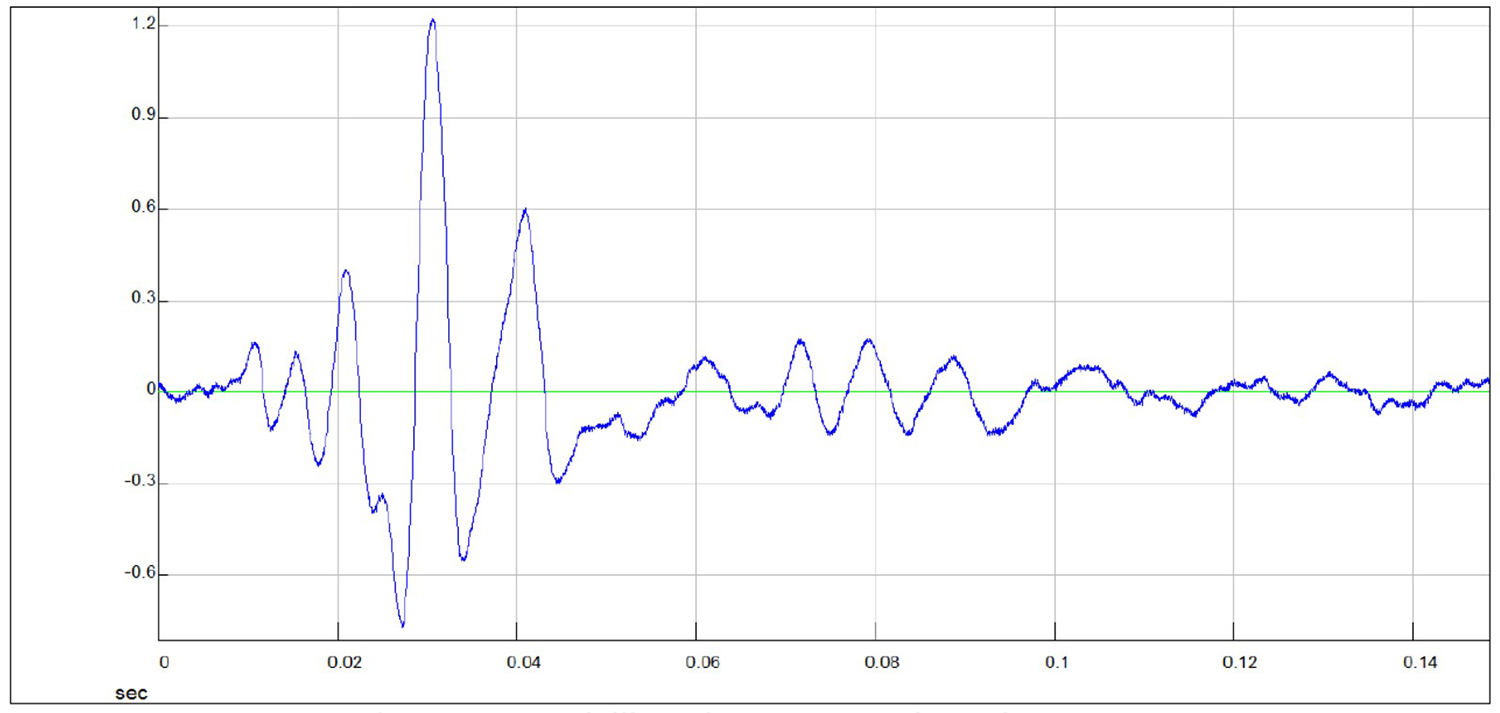
SIGNALS AT A DEPTH OF 5.38 M
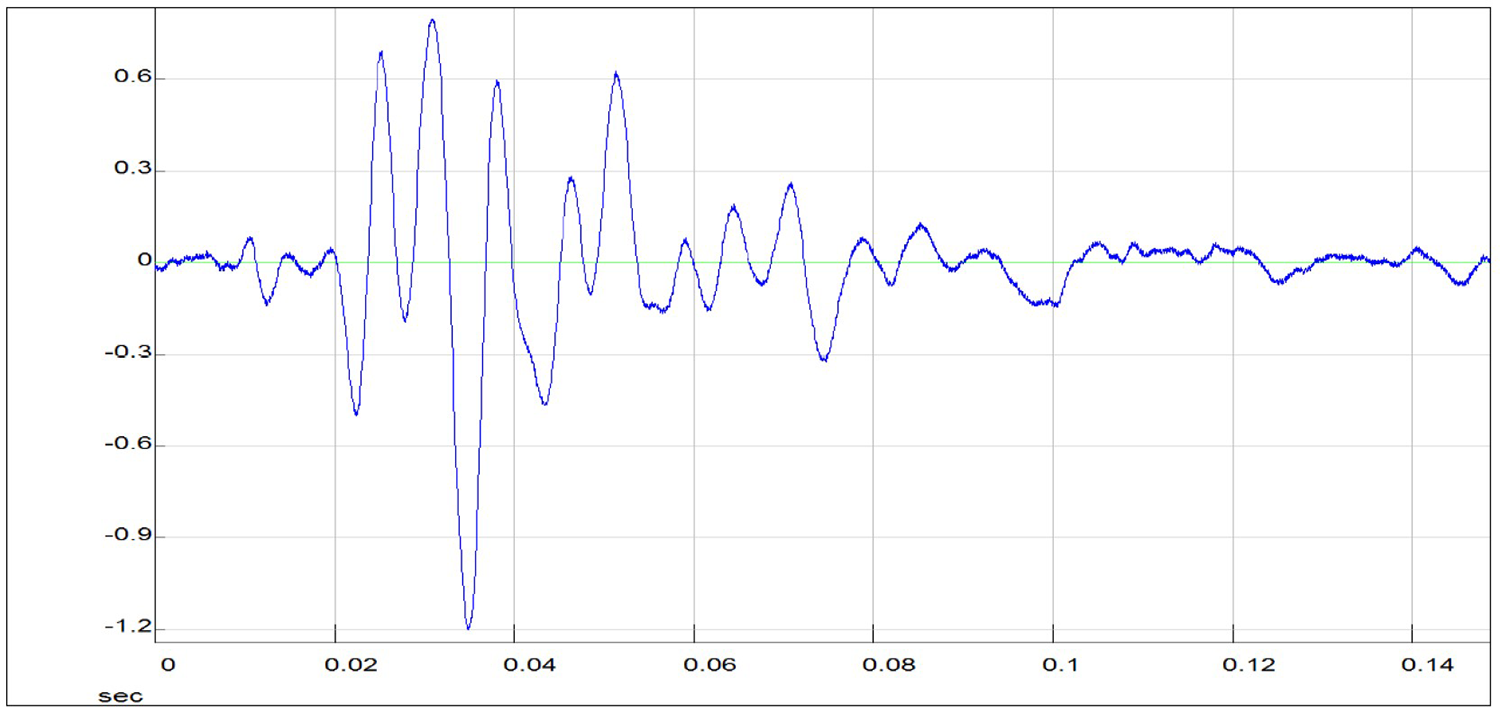
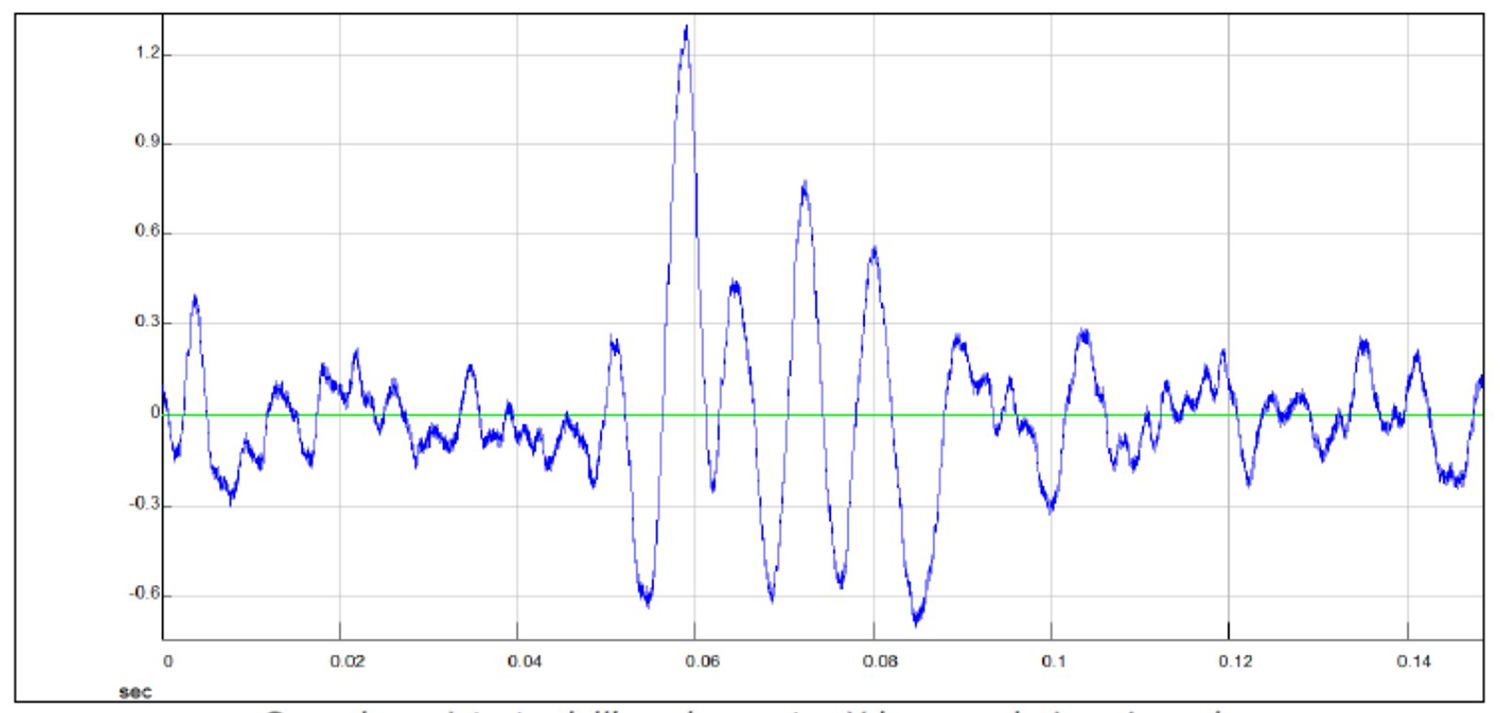
Signal recorded by the low right-bias Y accelerometer
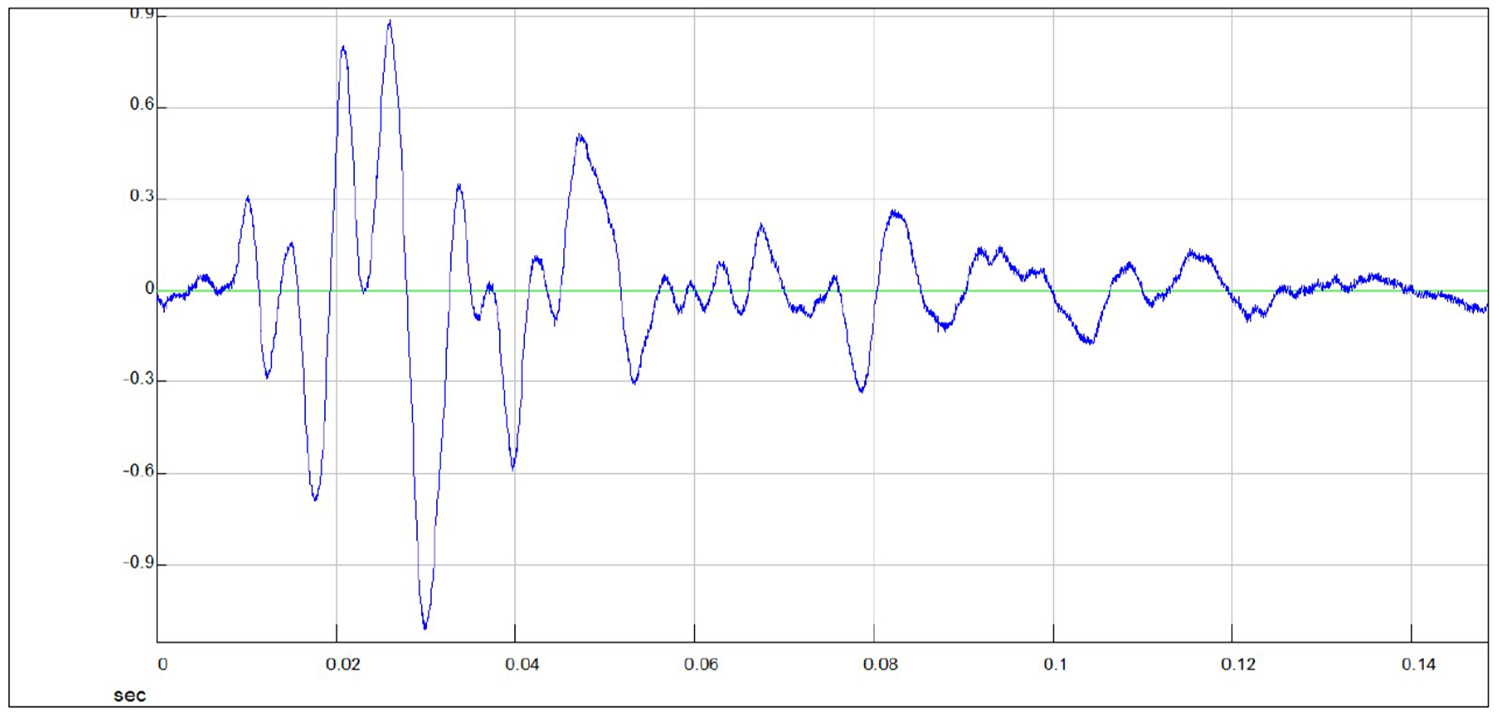
Signal recorded by the high right-biased Y accelerometer
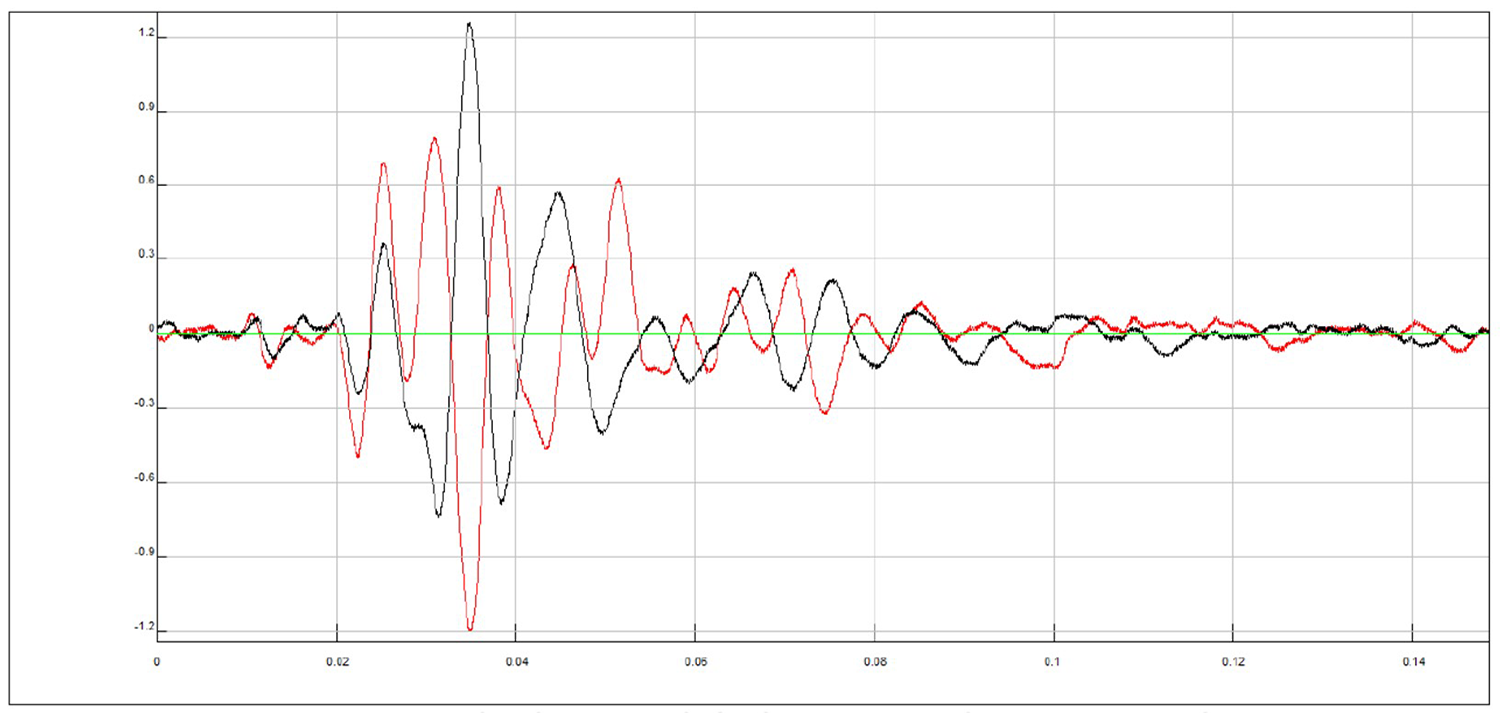
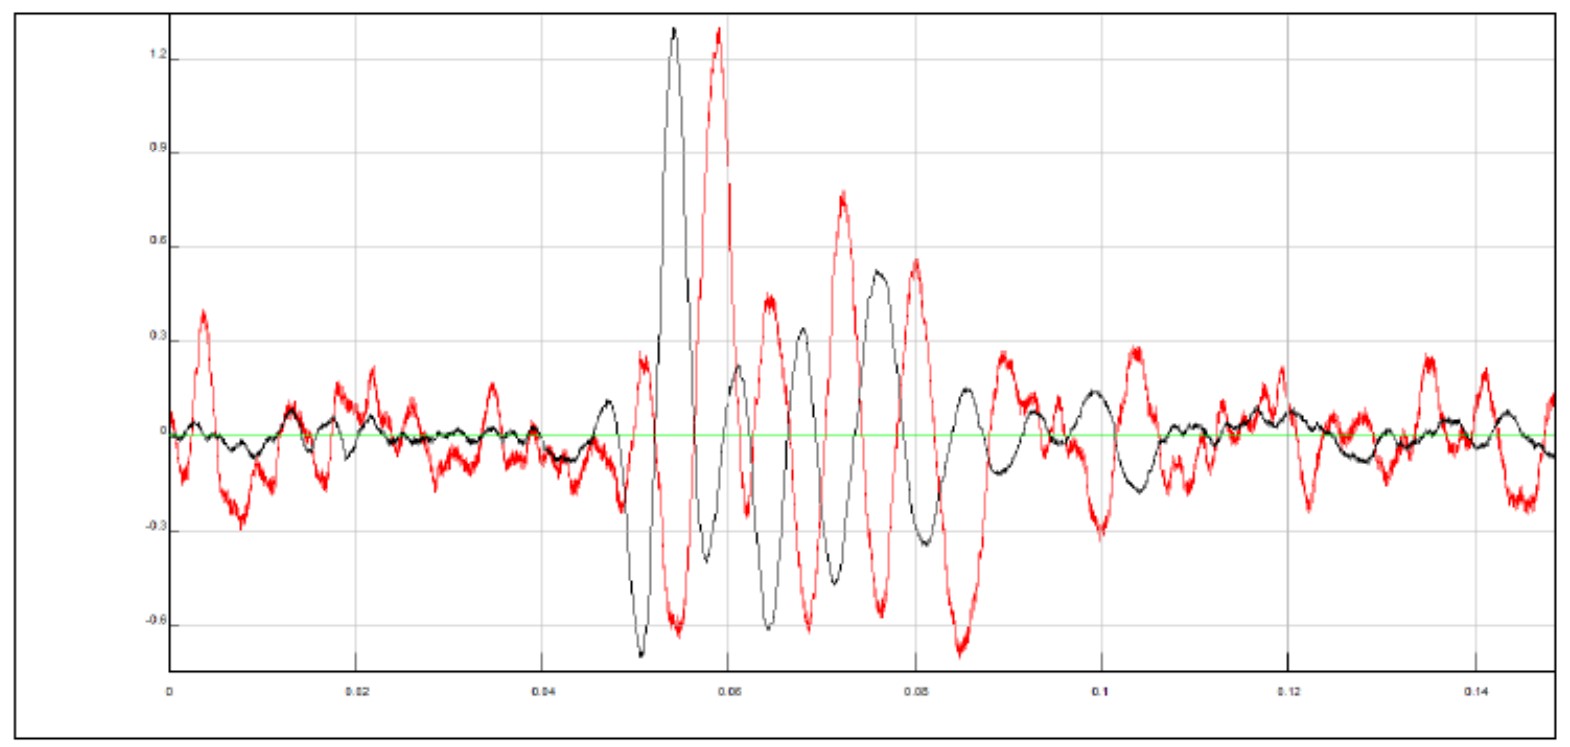
Cross-over of the two signals (left and right polarization) recorded by the low Y accelerometer
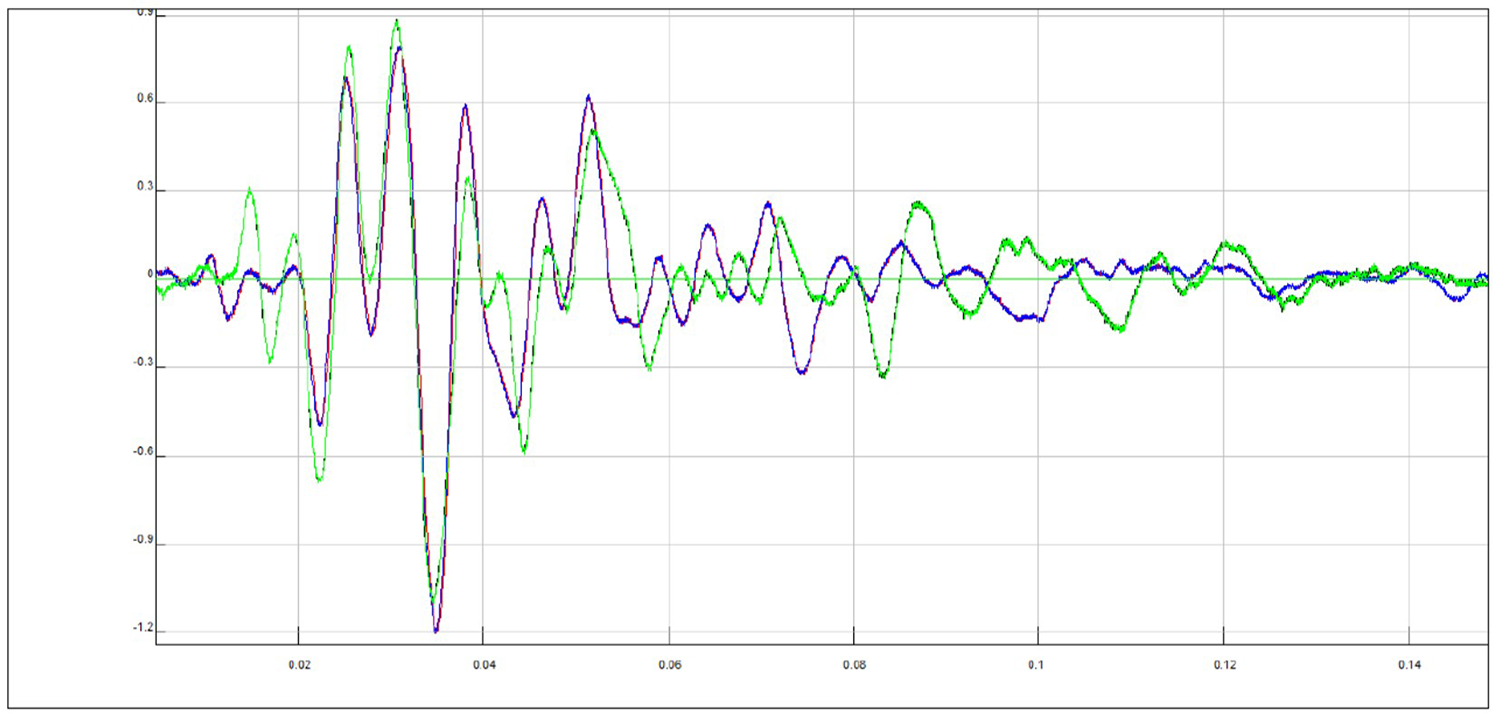
High right Y signal and low left Y signal: shifted with delay time calculated both by "manual picking" and by corss-correlation and superimposed (rephasing of the signals)
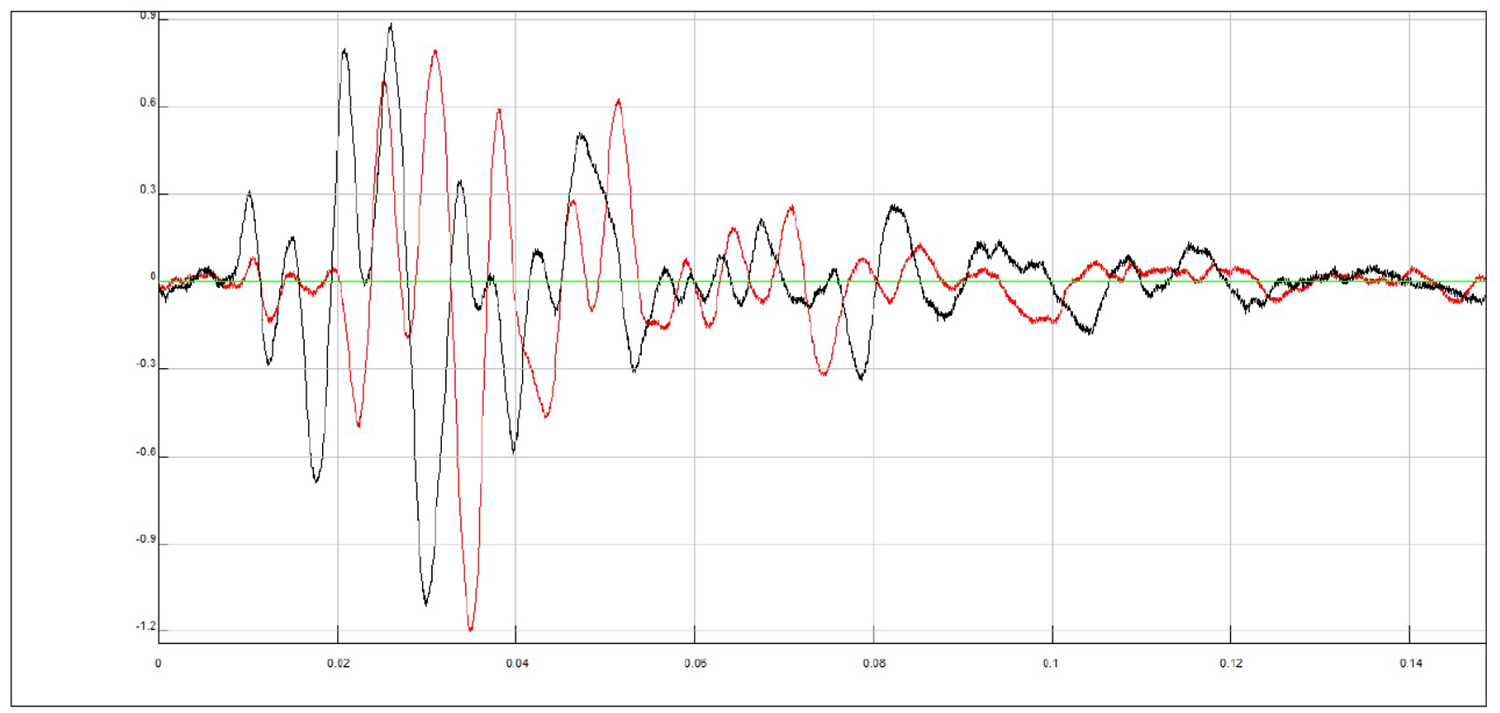
From these images you can clearly observe the phase shift (arrival delay time of the S wave between the high and low accelerometer) of the two signals and you can calculate the travel time.
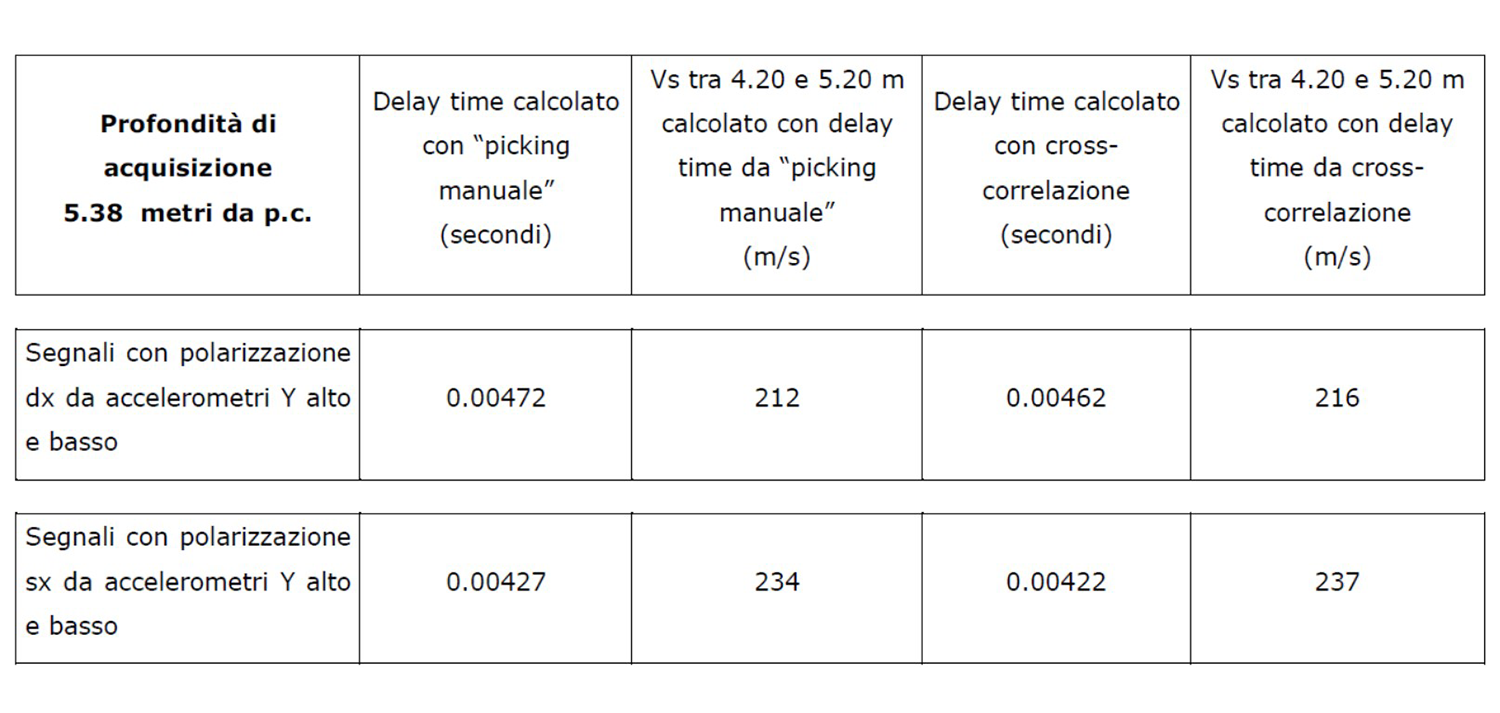
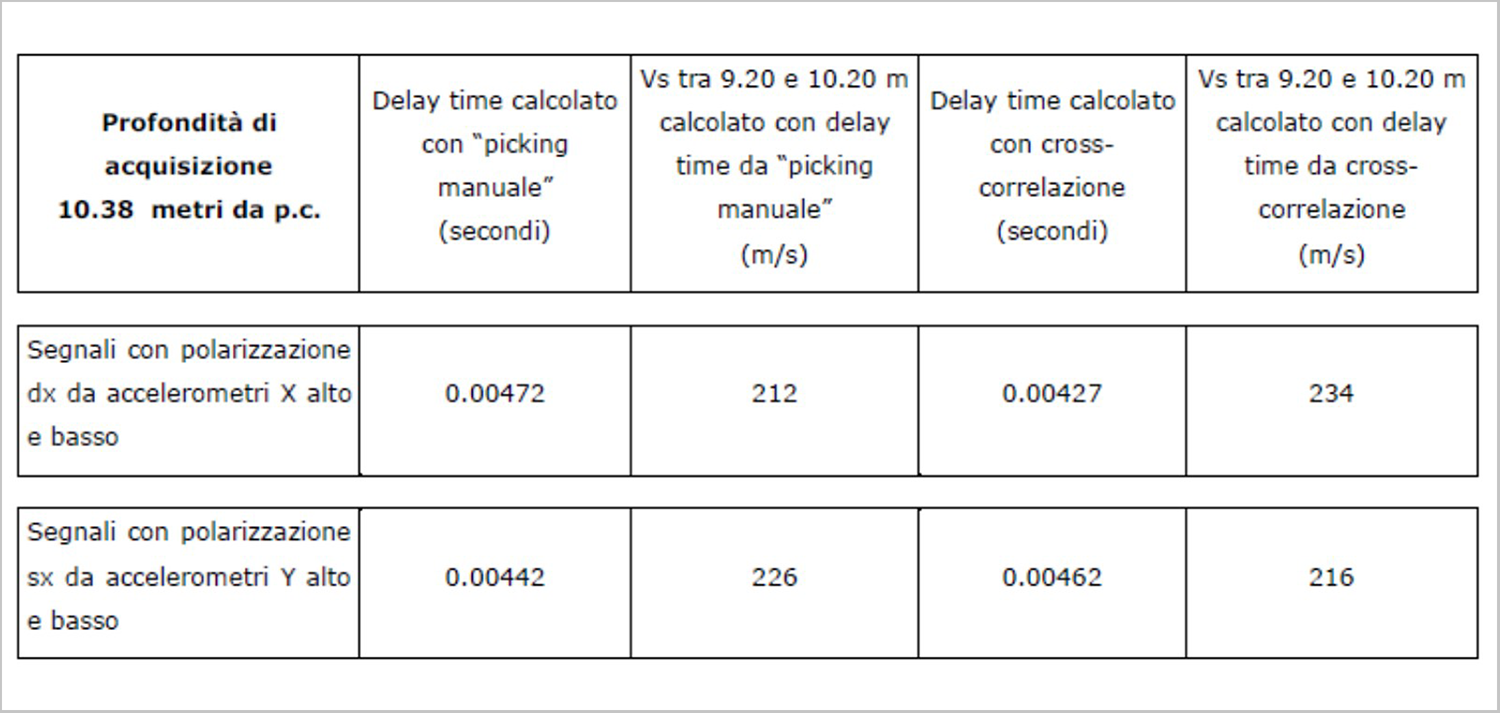
The following table shows the times calculated both, with the "manual picking" method and with the cross-correlation function.
The following table shows the times calculated both, with the "manual picking" method and with the cross-correlation function.
SIGNALS AT A DEPTH OF 10.38 M
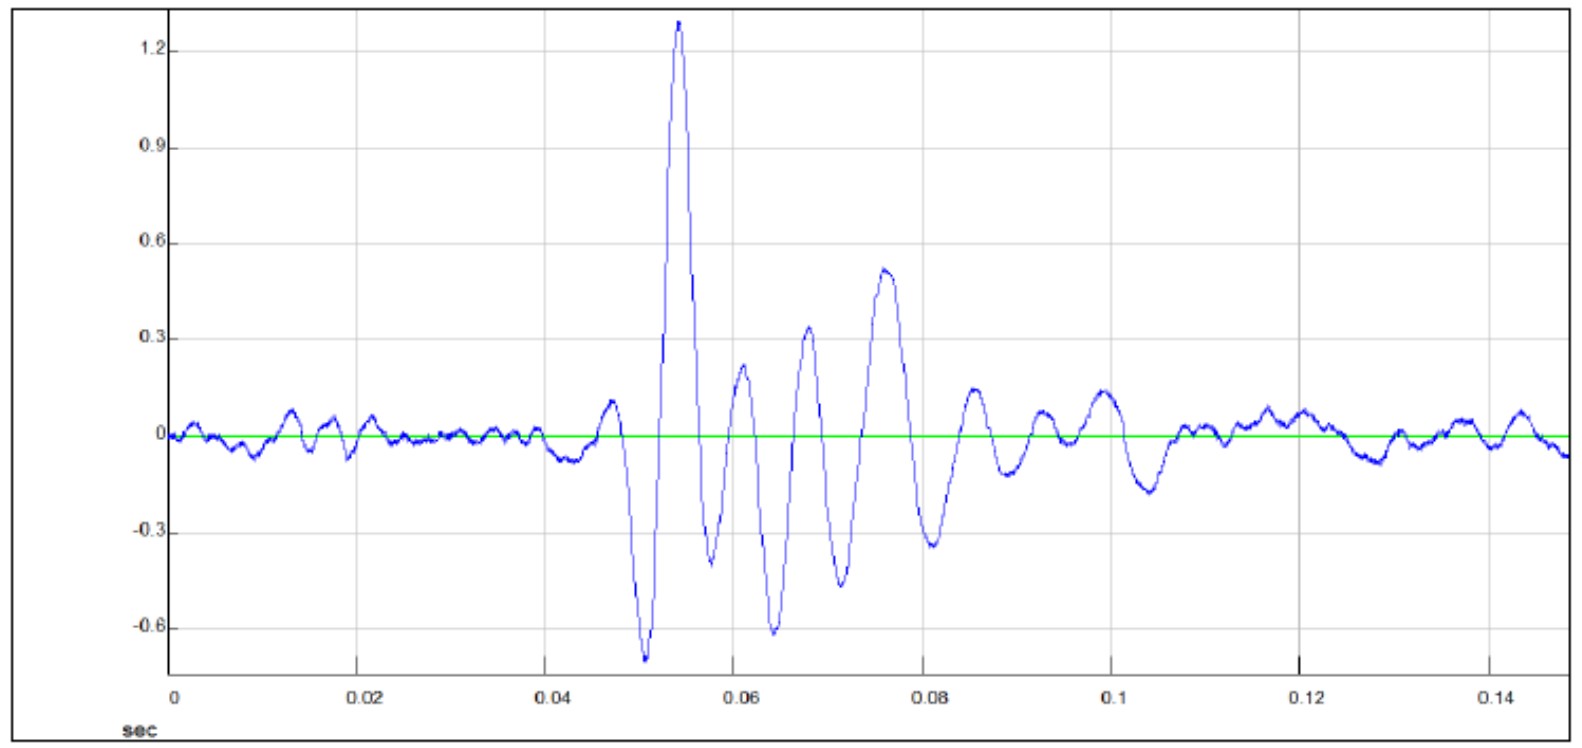
Signal recorded by the high right-biased Y accelerometer
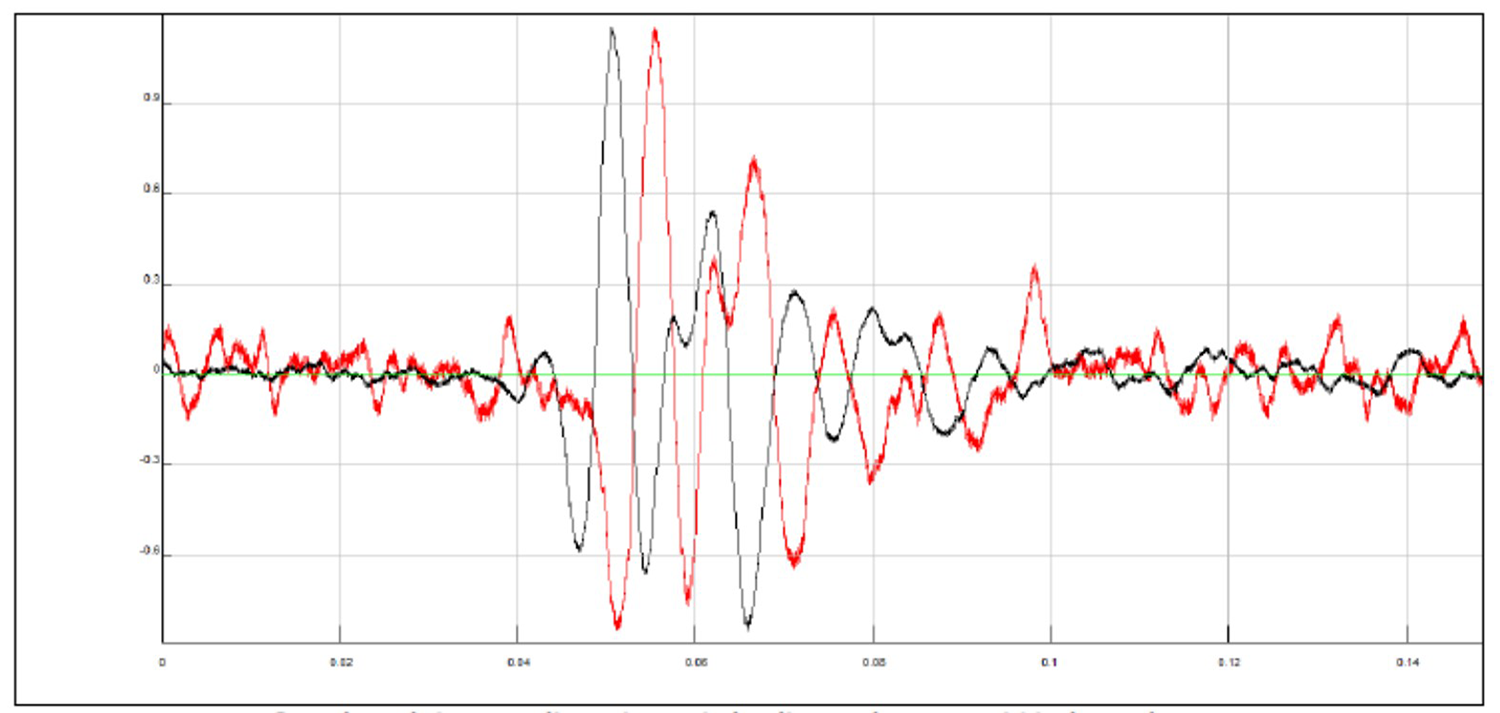
Overlay of the signals recorded by the high and low Y accelerometers polarization on the right; you can observe the delay time between the two signals
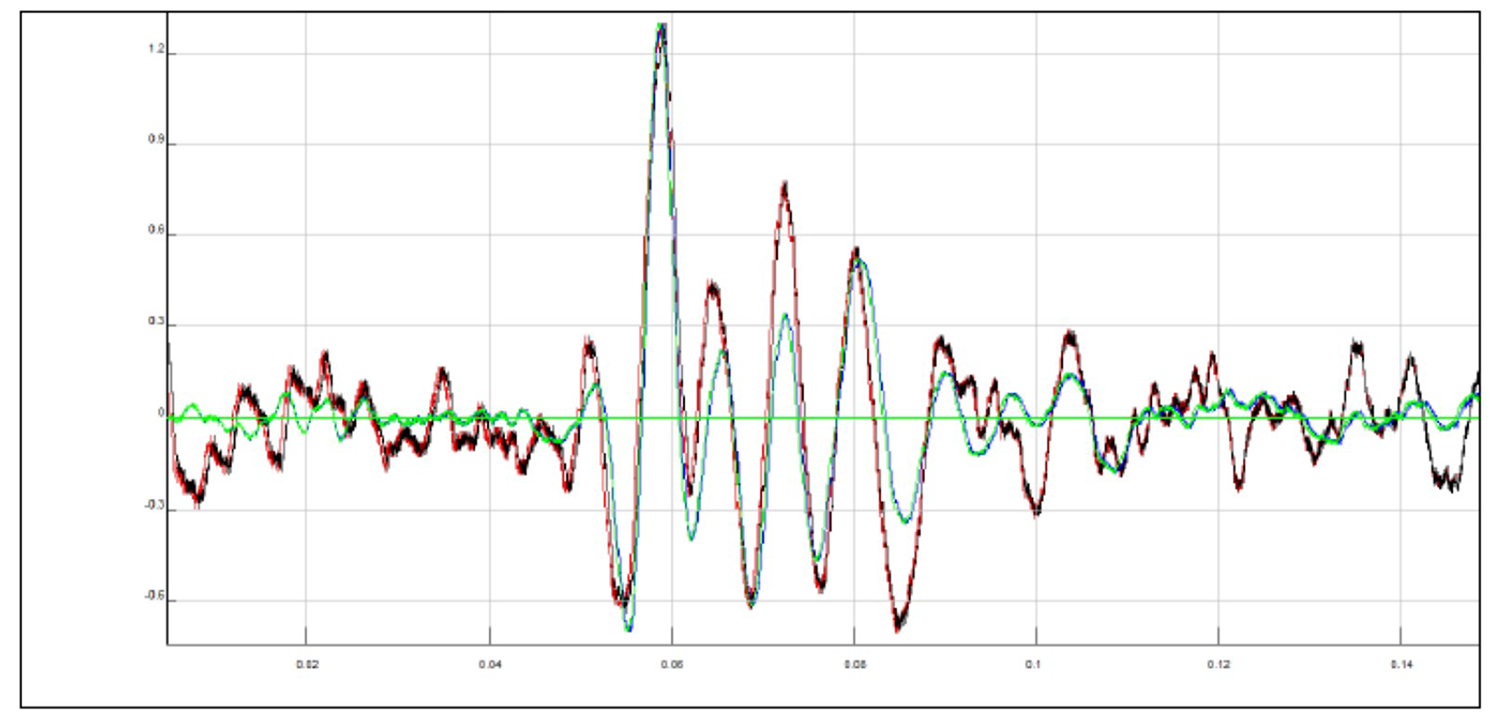
High right Y signal and low left Y signal: shifted with delay time calculated both by "manual picking" and by corss-correlation and superimposed (rephasing of the signals)
CONCLUSION
The test performed provided reliable and valuable data that could be immediately evaluated in the acquisition phase. The shear wave speeds, obtained from the processing performed, are in agreement with the stratigraphic data obtained from the analysis of the data measured during penetration by the other sensors of the seismic piezocone.